Wednesday, September 11, 2013

Non Functional Requirements Checklist


Here is a Check list of non functional aspects of a software system. These also needs to be planned for along with all the features.
This is a very general checklist and can be customized with exact expectations for the products.
The last two columns can be used to record expectations and criticality.


Category
Description
Expectations
Criticality
Capacity & Space
Number of concurrent users


Number of transactions processed per hour


Growth Requirement ( Users , Space, Transactions)


Maximum File storage space allowed  for each user/company ???


Minimum free Memory required to be available on server all the time


Response Time
Login to the system


Loading a  screen with single record


Loading a screen with Multiple Records ( Grid View)


For Add/Edit a single record


Batch update Operations


Search  a record


Export with records --- 20


Import with records --- 20


Upload File of size ---500 mb


Upload File of size ---


Download of file of size ---


Download of file of size ---


Reports


Log Reports


Scalability
Hardware scalability


Vertical Scalability - Can the Site be replicated to multiple locations for catering to increasing user base


Data Archiving
What is the limit after which data in key tables should be archived


What is the criteria for identifying data to be archived


Portability
Browser Supported -


OS Supported ( for client installable App) ---


Minimum System configuration ---


Memory Space required for Installation( for client installable App) --


Install ability ( for client installable App)
Ease of Installation


Version upgrade process


Expected frequency of version upgrades


Audit ability
Who visited a Web page


Who read or updated a database


Who read or updated a program


What operations were performed


Robustness
Error Handling


Exception Handling


Interface
With Email Client


Any Payment gateways


Support import/Export format of some other system


Any accounting system


Availability
System Up Time


Defined Maintenance window


Data Backup Policy
On what frequency data ( database +Files) should be backed up


Data backup location ( for disaster recovery process)


Security
Security of servers


Security of Files in server


Security of Database server


Security of records in database


Security during data transmission


Data Privacy


Encryption policies


Here is another of my post about non functional requirements

Thursday, August 8, 2013

Product Feature Prioritization- KANO Model


New requirements are always bombarding product managers. A new requirement can be in the form of :
               enhancing an existing feature    or               adding entirely  new features in product

list of features to be developed is long 
                        => time & resources  to develop are low

While some choices are straight forward , often their are competing features and its difficult to pick the priority of one feature vs the other feature.

Kano Model is a solution to this problem

Why Product feature prioritization is crucial ?

  • A poorly conceived product can result in user dissatisfaction
  • Features in product are selling points for the product. It is important to come up with right set of features to attract potential customers
  • Absence of a certain feature at certain point in product evolution can lead to user dissatisfaction which may lead to drop in usage

Why Product prioritization is required ?

Usually product development is constrained by 
  • Cost
  • Resource
  • Time
What ever is desired cannot be developed in one go

During initial  development phase :
        It is important to come up with minimal viable product (MVP). An MVP is basically the minimum feature set required to make product usable & acceptable by customers

After the initial release :  
       It is important to prioritize feature development based on factors such as
  • Customer needs
  • Pain areas in using product
  • Performance 
      Features which are more critical need to be put first in the row to provide an early relief.

How to set priority ?

This is one area where the art and science of product management converge!

You must be passionately committed to your customers and stakeholders. At the same time you should be able to objectively set priorities to help them. 

It is important to delight your customers , but at the same time it is important to understand your constrains and take the right decisions.

Choosing the right tool and mechanisms for making decisions is very critical.  Kano Model is one such tool.

Kano Model for prioritization

The Kano Model is a theory that was developed by Noriaka Kano in the 1970s and 1980s while studying quality control and customer satisfaction. 
Kano Analysis allows you to classify product (or service) features according to their impact on customer satisfaction. 
It not only helps you in deciding but also explaining your decisions to stakeholders.

As per Kano model any feature should fall in any one of these three categories:

 1 Basic ( customer expect these )

A basic product feature is one that is essential for a product.  
Not having this type of feature will leave customers dissatisfied. However having this feature will not add to satisfaction level as these features are taken as granted by customer.

For example if you are buying a car , a basic product feature for a car would be a steering wheel or an engine. A car needs both to function. 
If these features are not there , customers cannot use the product. However having then is not adding to satisfaction level. In other words these features are noticed only if they are absent.

2 Satisfiers ( customer demands these : more the better)

Customers wants these type of features as opposed to expect. The more we deliver, the happier the customer. Doing well here allows us to create satisfied customers.

Some examples could be lower prices, larger amount , faster delivery , greater reliability etc.
For example a satisfier feature  for a car is fuel efficiency. People tend to prefer cars with a better fuel efficiency.
More of these types of features are there in product , more satisfied the customer will be.

 3 Delighters ( customer do not demand but is highly satisfied to have them)

 Delightful feature are ones that are neither necessary nor demanded by customer . But if they are added they really can really excite and raise satisfaction level to very high level. 

For example for a car, a delightful attribute could be a convertible roof. On the right sporty car and for the right customers, a convertible roof can be really fun. But it’s not essential for the car to work, and also doesn't enhance the car’s performance.


How to use KANO Model

Map your features as per KANO Model to determine :
  1. What are the basic features  that users simply expect to be there and where would the absence of these features lead to frustration? Only develop these features to a level that they fulfill the requirement. Remember that any further enhancement after satisfaction level will not increase satisfaction.
  2. Which features are Delighters? Focus  efforts here and make sure you’re constantly developing new ones.
  3. Monitor your customer satisfaction and competition to ensure that features you think delight users haven’t slid into basic expectations and no longer help your customer satisfaction.
  4. Find and focus on sustainable delighters that truly differentiate your product and continue to deliver customer satisfaction over time

Changes in feature categories

It is important to remember that category of features may keep on changing due to following factors:
  • New competitive products emerging in market
  • Higher expectation from customers after using a feature
  • Tendency to take a feature as granted ( basic) after using it for long time.
Therefore it is important to ensure that category of features is revised from time to time.

Product managers need to keep track that which delightful features have become satisfier and eventually basic features. It is also important to keep on adding delighters to keep customers excited.

The Kano Model in action

Now that what Kano model is all about , how can you go about gathering data to plot features as per kano model. Customer Survey is a great method. Basically two questions are asked about each proposed feature:
    1. What do you think of the product if it includes feature X?
    2. What do you think of the product if it does not include feature X?
    There can be three valid responses to these question:
    1. I Like It
    2. It Does not matter
    3. I dislike it
    The answers to these questions determine the Kano categorization as follows:
    • Basic: Neutral for presence, Dislike for absence
    • Satisfiers: Like for presence, Dislike for absence
    • Delighters: Like for presence, Neutral for absence
    Once the features are categorized , you can think about next release in terms of customer satisfaction. Note that there is no "right" mix. The pick of feature will vary based on market conditions and state of product development cycle 

        Saturday, May 25, 2013

        Story points for estimation

        Most of the Agile team use story points these days for estimation. In this write up I have attempted to explain about story points , when to use it and when not to use it.


        What is a  story point?

        Story point is a random measure for estimation used by Agile teams. This is used to determine the size of  effort required to complete the development of a user story.

        Remember Story points measures size of effort and this should not be confused with person days required

        A story point is usually assigned after considering following factors
        • Effort required in development of story
        • Complexity of story
        • Unknowns or risk factors in the development
        While all these may be factors for determining story points one should remember that the purpose of story point is to get an idea of the size of effort required to develop the story.

        How to assign story points ?

        Pick a baseline story

        In the beginning team picks up a baseline story and assigns some story point to that story. Rest of the stories are assigned story points based on their comparative size with the baseline story.
        Baseline could be different for different teams. For example one team can assign 5 where as other can assign 3 to the same story.  This is perfectly fine as long as same baseline is used for estimating all the stories of the backlog. Normally these baselines are fixed at organization levels so that matrix from one project can be used for planning other projects.

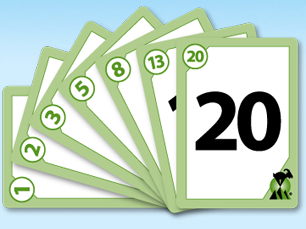
        Planning Poker for estimation


        Planning poker is among one of the popular techniques for story point estimations.  Here a team is formed for estimation. It may constitute the entire project team or some selected representative depending on project structure. It is recommended to have representation from QA and design team also while doing estimation. 

        Each story is discussed and individual estimations are made for each of participants. If there are wide difference between estimators then brainstorming is done with reasoning for each estimate. After discussion re estimation is done. This process  continues for each story until estimations converge.

        Use Estimation series 

        Most commonly modified  form of Fibonacci series is used to assign story points. It looks like           1,2,3,5,13,40,100. 
        Some teams also use powers of two, or have a scale like 1, 2, 5, 8, 20
        The idea is to use a non linear scale which help in making decisions. for example its much easier to say it is more 8 than 5 to say its more 6 than 5.

        How can story points be used?

        This is used for relative measurement.It is used to compare user stories in a product backlog and give a long term prediction about product release.
        Average Velocity of the team can be calculated based on story points completed each sprint. This average velocity can then be used for preparation of release plan .
        For Example let say a development team comes up with following data during first 6 sprints :
        Sprint 1 - Velocity 28 story points
        Sprint 2 - Velocity 28 story points
        Sprint 3 - Velocity 32 story points
        Sprint 4 - Velocity 30 story points
        Sprint 5 - Velocity 34 story points
        Sprint 6 - Velocity 28 story points
        Based on this data average velocity for this team would be : 30.
        This figure can be used for assessing time required to complete items in product backlog.
        One should remember that these are high level figures and efforts should also be allocated to some other standard activities while preparing release plan. Some example of the standard activities are :
        • Scope for addition of new features and enhancements 
        • Effort for bug fixing and re factoring
        • Effort for deployment

        When not to use story points?

        For Sprint Planning

        Story point are good tool for doing release planning , they  should not be used for sprint planning. For sprint planning each story should be broken down into required task and effort estimation should be done for each task in hours. This is important because a sprint target is commitment from the team and they should be absolutely clear on what they are committing on.

        For measuring productivity of team

        Using story points or ideal days to measure productivity is a bad idea because it will lead the team to gradually inflate the meaning of a point.  Team might tend to assign higher story points if   they are being evaluated on productivity as measured by the number of story points finished per iteration.
        Productivity can be measured by other means like number of backlog items delivered or % of backlog items completed Vs planned

        For relating story points to hours

        Story points are not directly related on hours so they should not be compared.

        Why use Story points vs Hours / mandays ?

        Help in separation of size and productivity

        The amount of time it will take to complete an item depends on factors like skill set , productivity etc.
        For example consider the distance between two cities in 200 miles. It will take more time to travel if we go walking, less if we go by a car and even less if we fly using a helicopter.  While the distance between the cities is constant , the time it takes to travel vary on the means of transportation chosen. 
        Similarly while the size of an backlog item is constant , time it will take to complete the item varies based on team chosen to complete the item. 
        Using story points we are measuring the constant which was distance in our example. 

        Takes away need to commit time  

        Story point based eliminates removes commitment of time from developers. This helps them in focusing on size of problem rather than worry about making commitments.  This is especially important because during initial phases only high level requirements are known and its difficult to give exact time commitments.

        Thursday, May 16, 2013

        Metrics for Agile Product Development


        Metrics play an important part in any project. They provide data points to analyse performance and identify improvement areas . They help us study the trend so that we can assess  how we are doing.


        Why Care for Metrics

        • Metrics provide important feedback to the team which is important promote continuous improvement
        • Metrics helps project team evolve to get maximum output 
        • Metrics provide facts based on data collected and can be used for strategic decisions making
        • Its impossible to optimize a process if you don't know how to measure it.

        Reasons why metrics fail

        • Measuring unnecessary data
        • Measuring too much data
        • Failure to define  a compact set of metrics that are aligned with business priorities

        Business Metrics

        Business metrics are focused on measuring how we are doing and how we can get better. Here are some useful hints :
        • Time to market : Time taken for each feature from introduction till deployment
        • Return on investment : Revenue vs Costs of production 
        • Product quality : Number of post deployment defects reported
        • Product Design : Number of UI related enhancement requests received 

        Development Metrics

        Metric
        How to collect
        Why Collect this metric
        Mean Velocity
        Average of story points completed in each sprint
        Long term strategic release planning
        Actual Velocity vs Mean Velocity
        Actual velocity in a sprint compared to team mean velocity
        Determines the deviation from average productivity
        Sprint Burn Down
        Starting from day one of the sprint  till end of the sprint effort  remaining after end of each day
        Monitor  health of ongoing sprint
        Release Burn Down
        Starting from first sprint , story points remaining till present day
        Monitor progress for release
        Defect Density
        Defects in following buckets compared to total number of defects
           -  Missed Requirement
        -   Defect as per priority
        -  Code Review
        -   UI

        Analyze the root cause of problems in development
        Effort Breakdown
        Breakdown of effort in following buckets vs Total Effort
        -  Feature Development
        -  Big Fixing
        -  Refactoring
        -  Enhancements

        Analyze and enhance productivity of team
        Product Backlog Tracking
        -  Pending user stories after each sprint
        -  Number of new user stories added /deleted after each sprint
        -  Number of user stories without estimation
        Monitor work completed and new requirements which are added